Introduction
In this project, I wanted to analyze the relationship between news consumption and voting behavior, specifically in the 2020 presidential election. I did so by choosing two news networks, MSNBC for Democrats and Fox News for Republicans. I believe that Democrats and Republicans who watch both MSNBC/Fox News will be more likely to vote for the opposite party than Democrats who only watch MSNBC and Republicans who only watch Fox News. This is an interesting research question because it analyzes the impact of watching a news network that may be less bias towards your respective party and analyzing whether that has an impact on who you vote for. In a world of ever growing polarization, this project offers an insight into the impact of news consumption.
Data Source and Variables
For this project, I did a cross-sectional design using data from the 2024 Time Series Study from the American National Election Studies Series. This data source was a survey based source comprised of 5521 respondents and over 1700 variables. The dependent variable of interest in my project is vote, which is a binary variable where 0=Donald Trump and 1=Joe Biden in the 2020 presidential election. The independent variable of interest in my project is the media variable, which is a categorical variable that classifies respondents into four categories: Fox Only, MSNBC Only, Both, or Neither. I will be testing this relationship by running a linear regression on both parties, by filtering the data source into Republicans and Democrats, using the variable party, which is a categorical variable for “Democrat” or “Republican”.
Criteria for Hypothesis
In relation to this project, the null hypothesis would be that news consumption does not have a statistically significant effect on an individual’s voting behavior. In order to reject the null hypothesis, that a mixed media consumption, watching both MSNBC and Fox News, results in an individual being more likely to vote for the opposite party, respective to their party identification, will require a p-value<0.05.
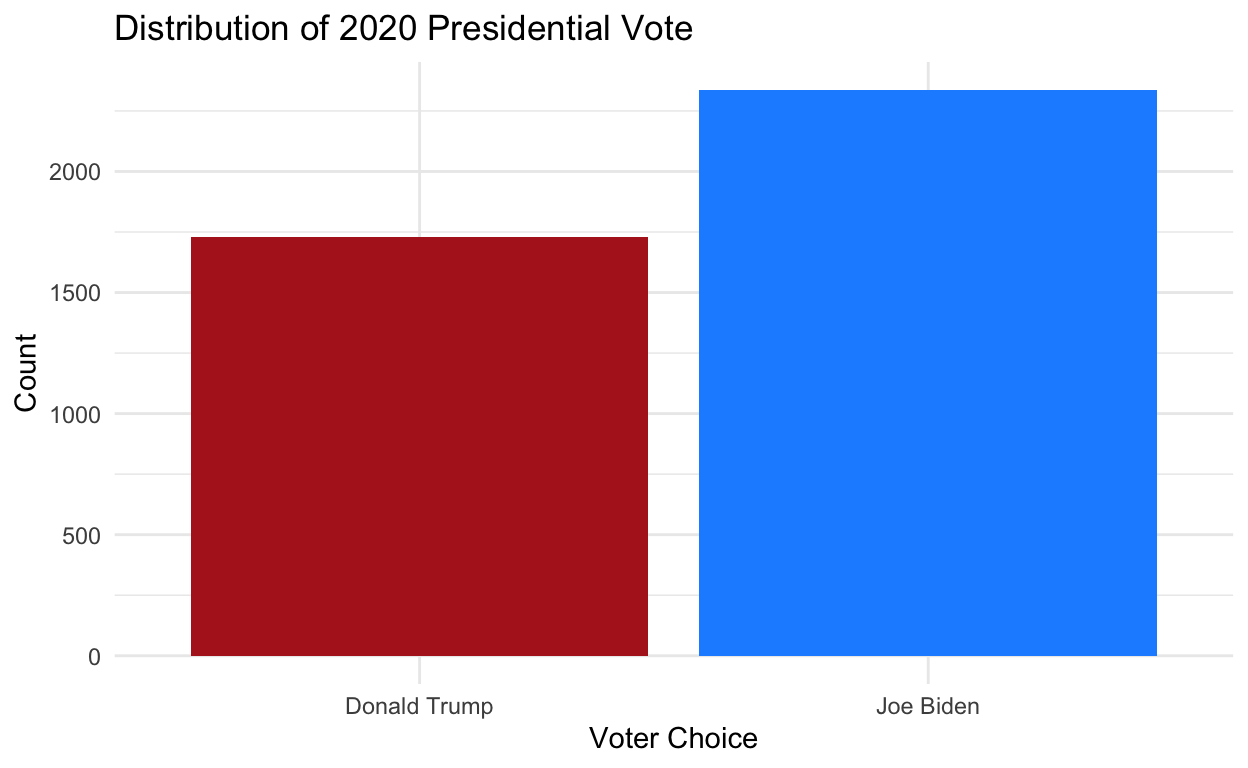
The plot above represents the dependent variable (vote) and its distribution in the data set. Roughly 2250 respondents voted for Joe Biden and roughly 1750 respondents voted for Donald Trump in our data set.
Results
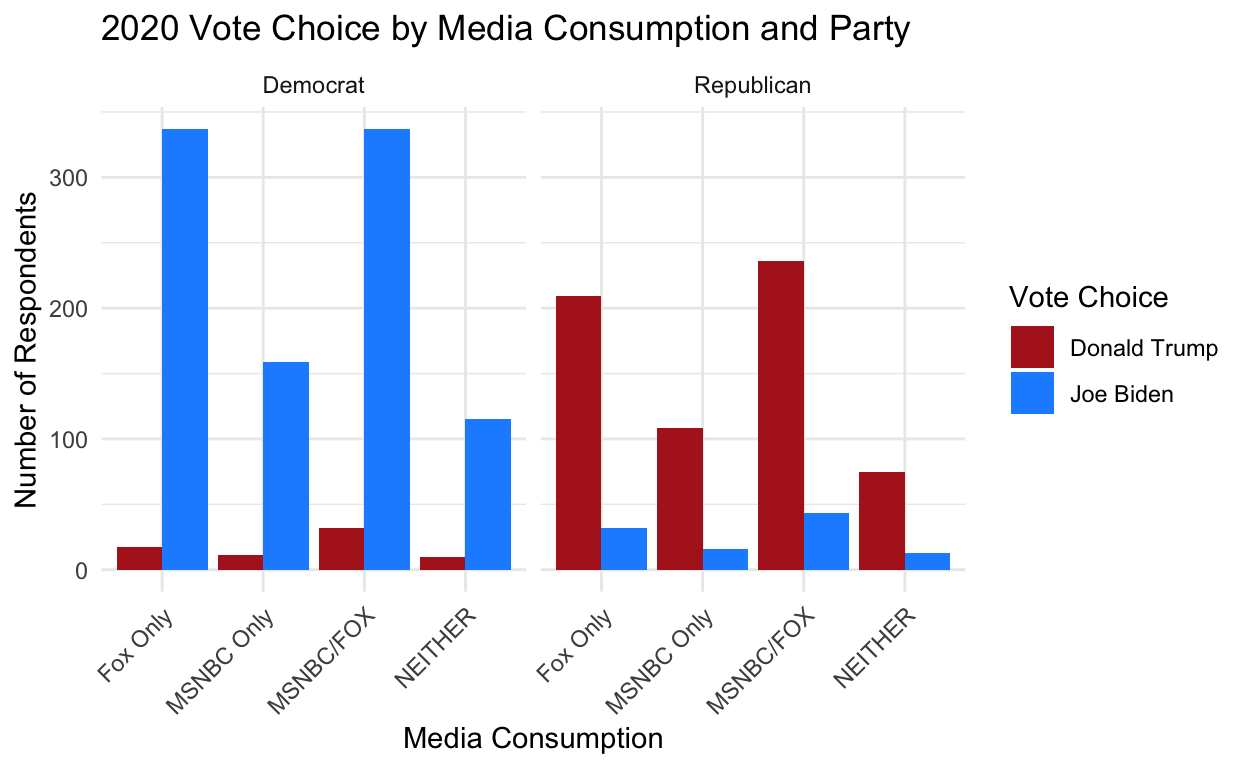
You can see from this graph that the largest number of both Democrats and Republicans who voted opposite their respective parties, came from the group who watched both MSNBC and Fox News.
Regression Outputs
| Republican Regression | Democrat Regression | |
|---|---|---|
| Intercept | 0.133 | 0.935 |
| s.e.=0.023 | s.e.=0.019 | |
| p=<0.001 | p=<0.001 | |
| Fox News Only | 0.017 | |
| s.e.=0.024 | ||
| p=0.480 | ||
| MSNBC and Fox News | 0.021 | -0.022 |
| s.e.=0.031 | s.e.=0.023 | |
| p=0.488 | p=0.348 | |
| Neither | 0.015 | -0.015 |
| s.e.=0.044 | s.e.=0.030 | |
| p=0.732 | p=0.608 | |
| MSNBC Only | -0.004 | |
| s.e.=0.039 | ||
| p=0.923 | ||
| Num.Obs. | 732 | 1018 |
| R2 | 0.001 | 0.004 |
| R2 Adj. | -0.003 | 0.002 |
Republican Regression Output
In this model, the Baseline Group is Republican viewers who only watched Fox News. When Republicans only watched Fox News, they had a 13.3% probability of voting for Joe Biden. When watching both MSNBC and Fox News, Republicans were 2.1 percentage points more likely to vote for Joe Biden. However, with a P-Value of .488, this result was not statistically significant and we fail to reject the null hypothesis that news viewership does not influence voting. Likewise, the Standard Error for MSNBC/Fox was .031, which is larger than our estimate. Since it is larger, we can further conclude that while we may have seen a 2.1 percentage point increase in Republican’s probability for voting for Joe Biden, it is not statistically significant.
Democrat Regression Output
In this model, the Baseline Group is Democrat viewers who only watched MSNBC. When Democrats only watched MSNBC, they had a 93.5% probability of voting for Joe Biden. When watching both MSNBC and Fox News, Democrats were 2.2 percentage points less likely to vote for Joe Biden. However, with a P-Value of .348, this result was not statistically significant and we fail to reject the null-hypothesis that news viewership does not influence voting. Likewise, the Standard Error for MSNBC/Fox was .023, which is larger than our estimate. Since it is larger, we can further conclude that while we may have seen a 2.2 percentage point decrease in Democrat’s probability for voting for Joe Biden, it is not statistically significant.
Causality
We should not interpret this relationship as a causal relationship. As discussed above, our p-values and standard error show that our results were not statistically significant. Secondly, confounding variables, such as selection bias, may be impacting the results. For example, in this project a respondent only had the option to identify as a Republican or a Democrat, when they may have been a moderate Republican or moderate Democrat and therefore been more likely to vote opposite their party or watch both news programs.
Conclusion
In summary, I found that while both Republican and Democrats in this study were more likely to vote for the opposing party when watching both MSNBC and Fox News, these results were not statistically significant. Therefore, we failed to reject the null hypothesis that news consumption does not impact voting. There were several limitations and threats to interference in this project. First, there was a considerable number of respondents who only listed one TV program compared to a significant number who listed the maximum of five. While this may be a true representation of the respondent, there is a chance that respondents who fell into the categories of Fox Only or MSNBC Only, did in fact watch both. Likewise, a confounding variable specific to this hypothesis would have been selection bias. Whereas in this study, the party identification was binary, either Republican or Democrat, a moderate Democrat may watch both MSNBC and Fox because they are moderate and likewise may be more likely to vote for a Republican.
One way I would improve this project is by changing how the independent variable was surveyed. The survey simply asked respondents whether or not they watched a specific news program. I think asking respondents to identify how much time they spend watching a specific news program would be better. For example, instead of a respondent saying they watched either a Fox News program or a MSNBC program, the respondent surveyed estimated how much of their total news consumption came from a specific program.
AI Disclousure
I used AI to make my graphs looks cleaner. I used theme_minimal()+theme(axis.text.x = element_text(angle = 45, hjust = 1)) to get rid of the grey background and tilt my x-axis labels so they didn’t overlap. I also used the code chunk cleannews$media <- as.factor(cleannews$media)cleannews$media <- relevel(cleannews$media, ref = "MSNBC Only") so that the intercept of my Democrat regression was MSNBC.
library(tidyverse)
news<-
read.csv("anes_timeseries_2024_csv_20250808 2/anes_timeseries_2024_csv_20250808.csv")
news<-news|>
 select("V241025","V241032","V241033", "V241039", "V241040", "V241104", "V241109", "V241179", "V241180", "V241108", "V241113", "V244055", "V244056", "V244057", "V244058", "V244059", "V241004" )|>
  mutate(party_reg=V241025, dem_caucus_vote=V241032, rep_caucus_vote=V241033, `2024_pres_vote`=V241039, `2024_pref_cand_voted`=V241040, `2020_pres_vote`=V241104, dem_likenes=V241109, harris_iedology_scale=V241179, trump_ideology_scale=V241180, `2016_pres_vote`=V241108, rep_likeness=V241113, tv_programs_watched=V244055, tv_programs_watched2=V244056, tv_programs_watched3=V244057, tv_programs_watched4=V244058, tv_programs_watched5=V244059, attention=V241004 )
news<-news|>
select(party_reg, `2020_pres_vote`, tv_programs_watched, tv_programs_watched2, tv_programs_watched3, tv_programs_watched4, tv_programs_watched5, attention)
news<-news|>
mutate(pres2020vote= case_when(
`2020_pres_vote`== 1~"Joe Biden",
`2020_pres_vote`== 2~"Donald Trump"))
news<-news|>
  drop_na(pres2020vote)
dependent<-news|>
  ggplot(aes(x=pres2020vote, fill = pres2020vote))+geom_bar()+labs(title="Distribution of 2020 Presidential Vote", y="Count", x="Voter Choice")+theme_minimal()+theme(legend.position = "none")+scale_fill_manual(values = c("Donald Trump" = "firebrick", "Joe Biden" = "dodgerblue"))
dependent
news<-news|>
  mutate(tv_programs_watched=case_when(tv_programs_watched==1~"Fox", tv_programs_watched==2~"Fox", tv_programs_watched==5~"Fox", tv_programs_watched==6~"Fox", tv_programs_watched==7~"Fox", tv_programs_watched==10~"Fox", tv_programs_watched==27~"Fox", tv_programs_watched==19~"CBS", tv_programs_watched==11~"CBS",tv_programs_watched==22~"CBS",tv_programs_watched==19~"CBS", tv_programs_watched==11~"CBS",tv_programs_watched==3~"MSNBC", tv_programs_watched==4~"MSNBC", tv_programs_watched==28~"MSNBC", tv_programs_watched==29~"MSNBC", tv_programs_watched==30~"MSNBC", tv_programs_watched==8~"CNN", tv_programs_watched==14~"CNN", tv_programs_watched==17~"CNN", tv_programs_watched==18~"CNN", tv_programs_watched==12~"ABC", tv_programs_watched==25~"ABC", tv_programs_watched==22~"ABC", tv_programs_watched==13~"NBC",tv_programs_watched==23~"NBC", tv_programs_watched==26~"NBC"))|>
  mutate(tv_programs_watched2=case_when(tv_programs_watched2==1~"Fox", tv_programs_watched2==2~"Fox", tv_programs_watched2==5~"Fox", tv_programs_watched2==6~"Fox", tv_programs_watched2==7~"Fox", tv_programs_watched2==10~"Fox", tv_programs_watched2==27~"Fox", tv_programs_watched2==19~"CBS", tv_programs_watched2==11~"CBS",tv_programs_watched2==22~"CBS",tv_programs_watched2==19~"CBS", tv_programs_watched2==11~"CBS",tv_programs_watched2==3~"MSNBC", tv_programs_watched2==4~"MSNBC", tv_programs_watched2==28~"MSNBC", tv_programs_watched2==29~"MSNBC", tv_programs_watched2==30~"MSNBC", tv_programs_watched2==8~"CNN", tv_programs_watched2==14~"CNN", tv_programs_watched2==17~"CNN", tv_programs_watched2==18~"CNN", tv_programs_watched2==12~"ABC", tv_programs_watched2==25~"ABC", tv_programs_watched2==22~"ABC", tv_programs_watched2==13~"NBC",tv_programs_watched2==23~"NBC", tv_programs_watched2==26~"NBC"))|>
   mutate(tv_programs_watched3=case_when(tv_programs_watched3==1~"Fox", tv_programs_watched3==2~"Fox", tv_programs_watched3==5~"Fox", tv_programs_watched3==6~"Fox", tv_programs_watched3==7~"Fox", tv_programs_watched3==10~"Fox", tv_programs_watched3==27~"Fox", tv_programs_watched3==19~"CBS", tv_programs_watched3==11~"CBS",tv_programs_watched3==22~"CBS",tv_programs_watched3==19~"CBS", tv_programs_watched3==11~"CBS",tv_programs_watched3==3~"MSNBC", tv_programs_watched3==4~"MSNBC", tv_programs_watched3==28~"MSNBC", tv_programs_watched3==29~"MSNBC", tv_programs_watched3==30~"MSNBC", tv_programs_watched3==8~"CNN", tv_programs_watched3==14~"CNN", tv_programs_watched3==17~"CNN", tv_programs_watched3==18~"CNN", tv_programs_watched3==12~"ABC", tv_programs_watched3==25~"ABC", tv_programs_watched3==22~"ABC", tv_programs_watched3==13~"NBC",tv_programs_watched3==23~"NBC", tv_programs_watched3==26~"NBC"))|>
  mutate(tv_programs_watched4=case_when(tv_programs_watched4==1~"Fox", tv_programs_watched4==2~"Fox", tv_programs_watched4==5~"Fox", tv_programs_watched4==6~"Fox", tv_programs_watched4==7~"Fox", tv_programs_watched4==10~"Fox", tv_programs_watched4==27~"Fox", tv_programs_watched4==19~"CBS", tv_programs_watched4==11~"CBS",tv_programs_watched4==22~"CBS",tv_programs_watched4==19~"CBS", tv_programs_watched4==11~"CBS",tv_programs_watched4==3~"MSNBC", tv_programs_watched4==4~"MSNBC", tv_programs_watched4==28~"MSNBC", tv_programs_watched4==29~"MSNBC", tv_programs_watched4==30~"MSNBC", tv_programs_watched4==8~"CNN", tv_programs_watched4==14~"CNN", tv_programs_watched4==17~"CNN", tv_programs_watched4==18~"CNN", tv_programs_watched4==12~"ABC", tv_programs_watched4==25~"ABC", tv_programs_watched4==22~"ABC", tv_programs_watched4==13~"NBC",tv_programs_watched4==23~"NBC", tv_programs_watched4==26~"NBC"))|>
  mutate(tv_programs_watched5=case_when(tv_programs_watched5==1~"Fox", tv_programs_watched5==2~"Fox", tv_programs_watched5==5~"Fox", tv_programs_watched5==6~"Fox", tv_programs_watched5==7~"Fox", tv_programs_watched5==10~"Fox", tv_programs_watched5==27~"Fox", tv_programs_watched5==19~"CBS", tv_programs_watched5==11~"CBS",tv_programs_watched5==22~"CBS",tv_programs_watched5==19~"CBS", tv_programs_watched3==11~"CBS",tv_programs_watched3==3~"MSNBC", tv_programs_watched5==4~"MSNBC", tv_programs_watched5==28~"MSNBC", tv_programs_watched5==29~"MSNBC", tv_programs_watched5==30~"MSNBC", tv_programs_watched5==8~"CNN", tv_programs_watched5==14~"CNN", tv_programs_watched5==17~"CNN", tv_programs_watched5==18~"CNN", tv_programs_watched5==12~"ABC", tv_programs_watched5==25~"ABC", tv_programs_watched5==22~"ABC", tv_programs_watched5==13~"NBC",tv_programs_watched5==23~"NBC", tv_programs_watched5==26~"NBC"))
news<-news|>
    mutate(MSNBC = case_when((tv_programs_watched %in% "MSNBC" | tv_programs_watched2  %in% "MSNBC" | tv_programs_watched3  %in% "MSNBC" | tv_programs_watched4  %in% "MSNBC" |tv_programs_watched5  %in% "MSNBC") & !(tv_programs_watched  %in% "Fox" | tv_programs_watched2  %in% "Fox" | tv_programs_watched3  %in% "Fox" | tv_programs_watched4  %in% "Fox" | tv_programs_watched5  %in% "Fox") ~ 1))|>
  mutate(
    FOX = case_when((tv_programs_watched %in% "Fox" | tv_programs_watched2  %in% "Fox" | tv_programs_watched3  %in% "Fox" | tv_programs_watched4  %in% "Fox" |tv_programs_watched5  %in% "Fox") & !(tv_programs_watched  %in% "MSNBC" | tv_programs_watched2  %in% "MSNBC" | tv_programs_watched3  %in% "MSNBC" | tv_programs_watched4  %in% "MSNBC" | tv_programs_watched5  %in% "MSNBC")~1))|>
   mutate(
    BOTH = case_when((tv_programs_watched  %in% "MSNBC" | tv_programs_watched2  %in% "MSNBC" | tv_programs_watched3  %in% "MSNBC" | tv_programs_watched4  %in% "MSNBC" | tv_programs_watched5  %in% "MSNBC") & (tv_programs_watched  %in% "Fox" | tv_programs_watched2  %in% "Fox" | tv_programs_watched3  %in% "Fox" | tv_programs_watched4  %in% "Fox" | tv_programs_watched5  %in% "Fox") ~ 1))|>
  mutate(
    NEITHER = case_when(!(tv_programs_watched  %in% "MSNBC" | tv_programs_watched2  %in% "MSNBC" | tv_programs_watched3  %in% "MSNBC" | tv_programs_watched4  %in% "MSNBC" | tv_programs_watched5  %in% "MSNBC") & !(tv_programs_watched  %in% "Fox" | tv_programs_watched2  %in% "Fox" | tv_programs_watched3  %in% "Fox" | tv_programs_watched4  %in% "Fox" | tv_programs_watched5  %in% "Fox") ~ 1))
news<-news|>
mutate(media=case_when(FOX==1~"Fox Only", MSNBC==1~"MSNBC Only", BOTH==1~"MSNBC/FOX", NEITHER==1~"NEITHER"))
cleannews<-news|>
  select(-tv_programs_watched, -tv_programs_watched2, -tv_programs_watched3, -tv_programs_watched4, -tv_programs_watched5)
cleannews<-cleannews|>
  mutate(party=case_when(party_reg==1~"Democrat", party_reg==2~"Republican"))|>
  drop_na(party)
cleannews<-cleannews|>
  mutate(vote=case_when(`2020_pres_vote`==2~0, `2020_pres_vote`==1~1))
ggplot(data=cleannews, aes(x=media, fill=pres2020vote))+geom_bar(position="dodge")+facet_wrap(~party)+theme_minimal()+theme(axis.text.x = element_text(angle = 45, hjust = 1))+labs(title="2020 Vote Choice by Media Consumption and Party", x="Media Consumption", y="Number of Respondents", fill="Vote Choice")+scale_fill_manual(
    values = c("Donald Trump" = "firebrick", "Joe Biden" = "dodgerblue"))
republican<-cleannews|>
  filter(party=="Republican")
democrat<-cleannews|>
  filter(party=="Democrat")
cleannews$media <- as.factor(cleannews$media)
cleannews$media <- relevel(cleannews$media, ref = "MSNBC Only")
democrat<-cleannews|>
  filter(party=="Democrat")
democrat_lm<-lm(data=democrat, vote~media)
republican_lm<-lm(data = republican, vote~media)
republican_lm<-lm(data = republican, vote~media)

library(broom)
rep_lm_clean<-tidy(republican_lm)|>
  select(term, estimate, std.error, p.value)|>
  knitr::kable(caption="Effect of Media Consumption on Republican Voters", digits=3, col.names = c("Variable", "Estimate", "Standard Error", "P-Value"))
dem_lm_clean<-tidy(democrat_lm)|>
  select(term, estimate, std.error, p.value)|>
  knitr::kable(caption="Effect of Media Consumption on Democrat Voters", digits=3, col.names = c("Variable", "Estimate", "Standard Error", "P-Value"))
var_labels <- c("(Intercept)"="Intercept",
"mediaFox Only" = "Fox News Only",
"mediaMSNBC/FOX" = "MSNBC and Fox News",
"mediaNEITHER" = "Neither",
"mediaMSNBC Only" = "MSNBC Only"
)
regressiontable<-modelsummary::modelsummary(list("Republican Regression" = republican_lm, "Democrat Regression" = democrat_lm),
coef_map = var_labels, gof_map = c("nobs", "r.squared", "adj.r.squared"), statistic = c("s.e.={std.error}", "p={p.value}"))
regressiontable